The role of a data scientist involves building and fine-tuning of models and improve processes and products in various business areas. Typical use cases involve marketing campaigns, customer churn prediction or fraud detection. Trained models should not only work on (seen) training data but also on new (unseen) real-world data. However, this requirement is typically not obvious to most decision makers involved, who tend to favour overfitted models and delude themselves with fabulous numbers and promises. The problems always arise straight after implementation when the results do not follow suit. It is thus the task of every responsible data scientist to manage expectations right and employ industries best practices as covered in our course on Machine Learning with R.
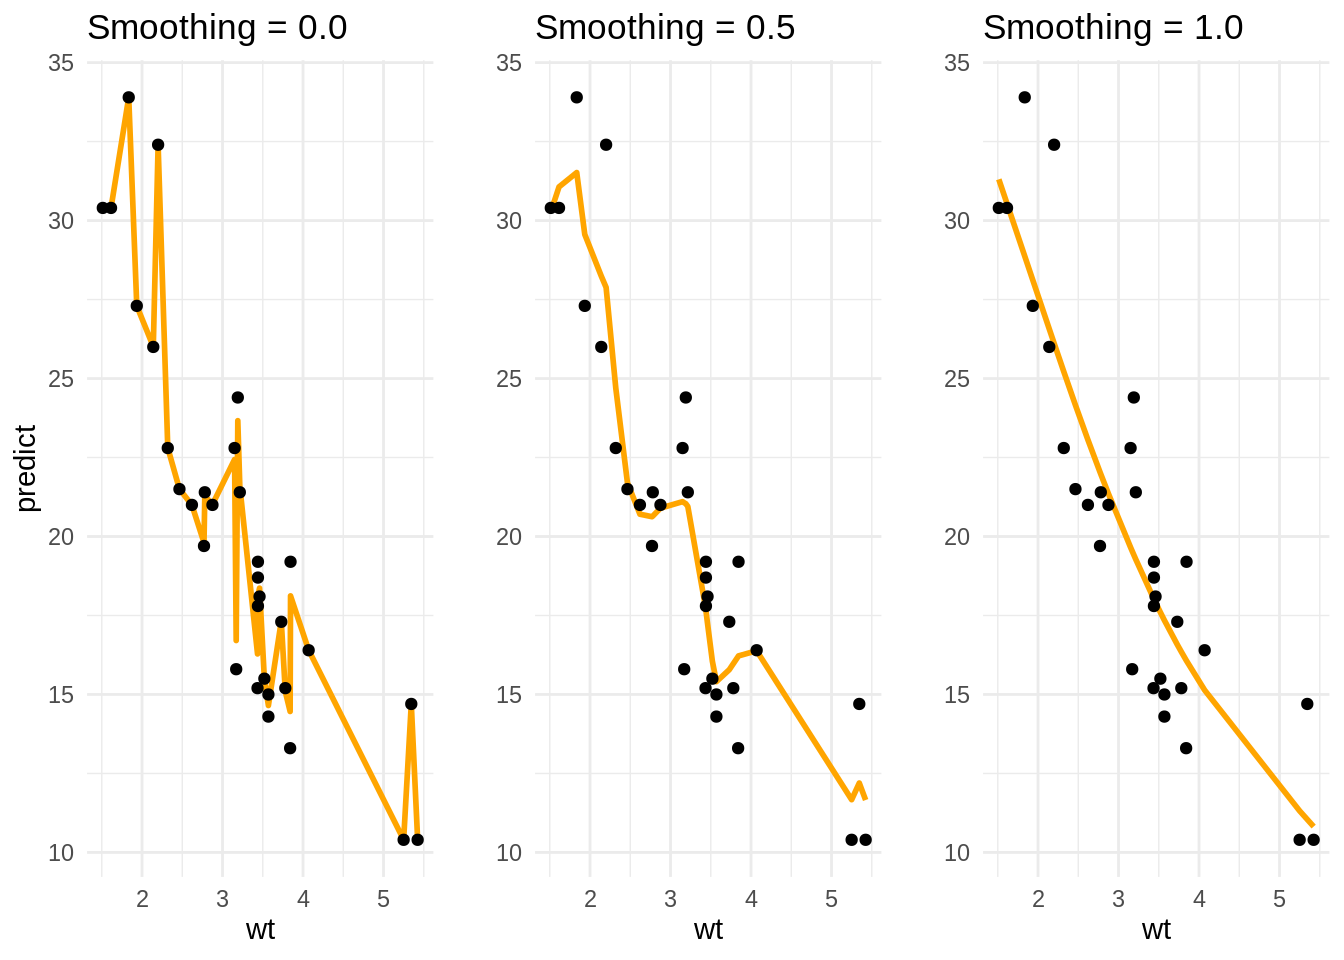
To see the problem of overfitting in action let’s look at a simple relationship in the famous mtcars dataset between the weight (wt) of a car in tonnes and its range per gallon (mpg, miles-per-gallon). Obviously, the heavier the car the less miles per gallon it goes (or the higher its fuel consumption). We have modeled the relationship using the smooth.spline() function in R and used the smoothing parameter (spar) as a parameter in the slider. We see that a spar close to zero seems to model the relationship quite well (smooth). By increasing the spar of the model it begins to fit observations more closely, thus its variance is increased. However, once spar gets closer to one the spline starts to loose its smooth shape and zig-zag—a sign of overfitting.
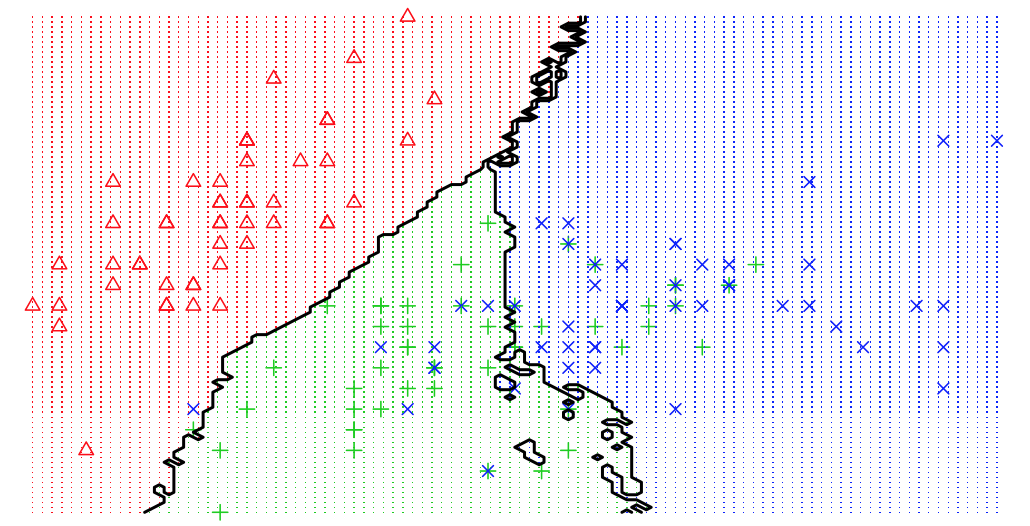
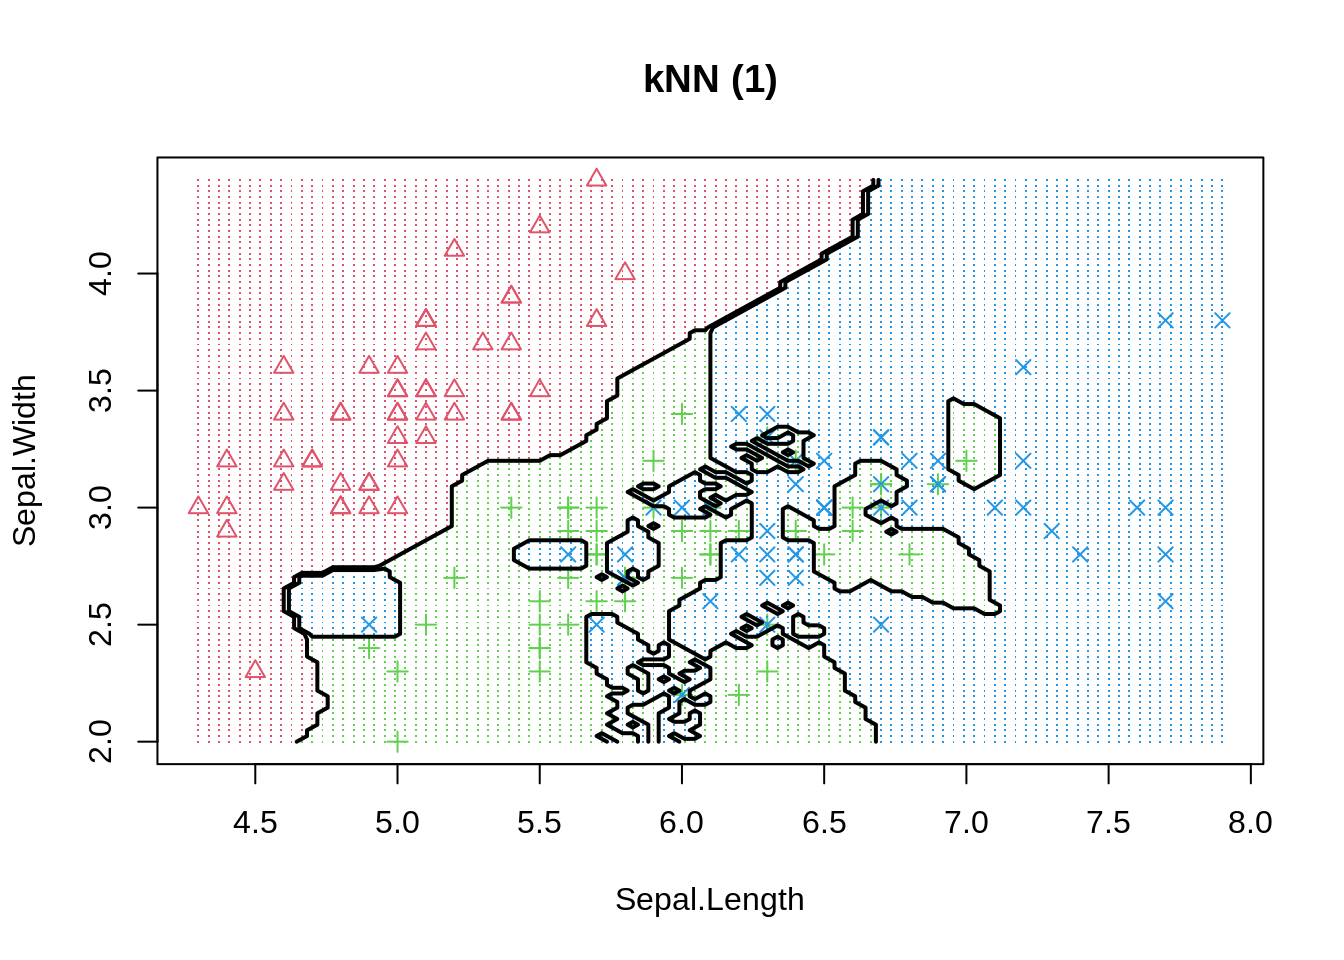
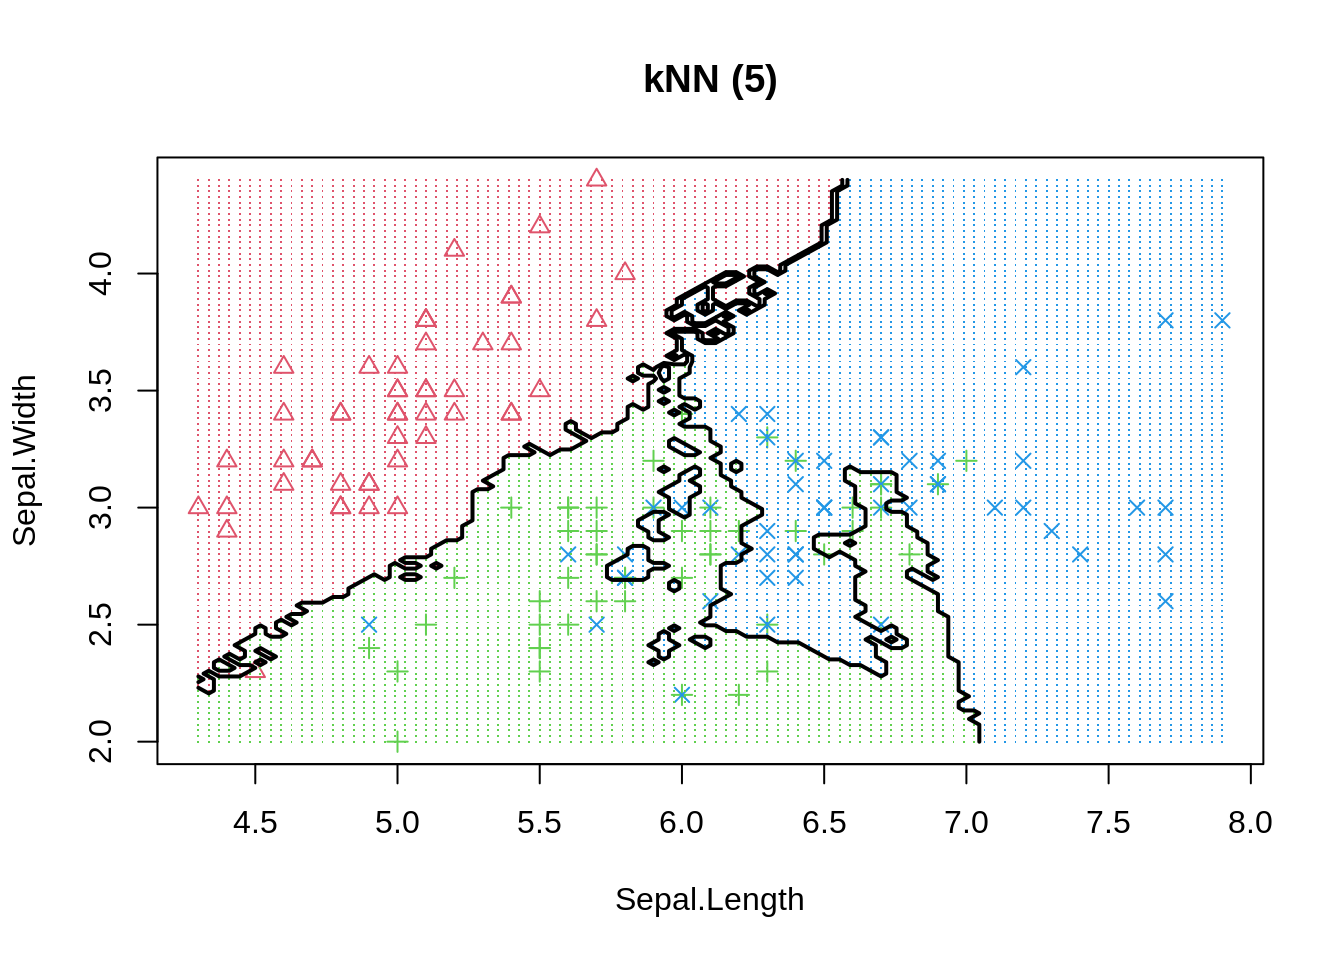
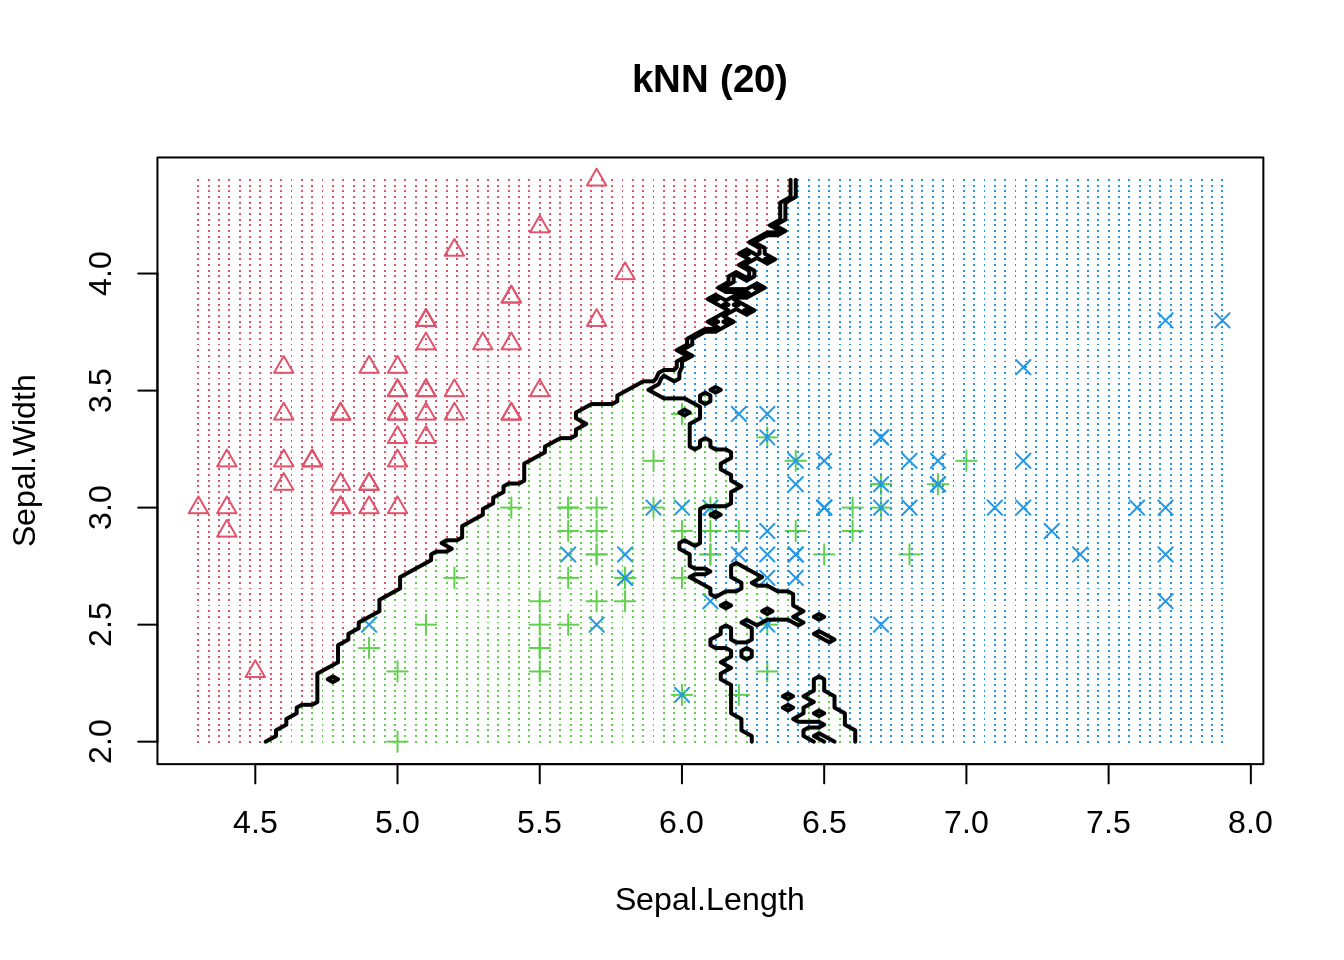
The same phenomenon can be shown in a classification example. We use the basic K-nearest neighbour model to differentiate 3 iris species among 50 flowers using the variables sepal length/width and petal length/width. The three classes can easily differentiated visually into three areas. By moving the number of neighbours closer to one we increase model variance and observe that decision boundaries get fragmented.
Even if more observations can be correctly classified in-sample, or similarly, the regression error could be reduced, we should always keep in mind that model performance is only judged by out-of-sample data. Thus, decision makers should always be much more aware of how the model has been be selected instead of how good the reported performance is. To be on the safe side, and if enough data is available, we can always keep a final test set aside (not available to model developers) to evaluate actual performance - pretty much like a Kaggle competition.
So my final recommendations would be that:
- Don’t fool yourselves and be honest with out-of-sample data/performance.
- Manage expectation of decision makers well - be realistic.
- If results look extremely good at your first try - they most probably are wrong.
Happy (Correct) Fitting!